Absorbing The External Stresses of a Disaster

Community Resilience
In the summer of 2020, the Census Bureau launched a new and innovative data tool for national agencies and local communities, the Community Resilience Estimates (CRE). The CRE tracks how at-risk every single neighborhood in the United States is to the impacts of COVID-19 and other local disasters, by measuring the capacity of individuals and households at absorbing, enduring, and recovering from the external stresses of the impacts of a disaster.
Data from the U.S. Census and Federal Reserve can help us understand “how different segments of the population are making gains or are impacted by the pandemic or the recent economic recession.” Census Bureau surveys and programs have long measured equity gaps across demographic groups, and publicly available data and tools can help identify vulnerable and underserved communities. One such tool is the Community Resilience Estimates for Equity and Disasters (CRE). The CRE dataset provides information about the nation, states, counties, and census tracts from different data sources.
Research shows that resilience (or risk or vulnerability) can be predicted by individual and household characteristics. Individual and household characteristics from the 2019 American Community Survey (ACS) were modeled, in combination with data from the Population Estimates Program, to create the CRE. The CRE uses modeling techniques that are flexible and can easily be modified for a broad range of uses (economic recovery, tornadoes, floods, etc.).
Risk factors from the 2019 ACS include:

One may wonder how a community’s resilience would apply to child care and early childhood, but the CRE tool is meant to put a magnifying glass on communities that are at risk for various characteristics. For instance, the measure of social vulnerability the CRE provides could be generically applied not only to natural disasters, but economic failures. The CRE data lets us know if sociodemographic indicators are statistically different than the national level, which may help identify inequities. The mere fact that the word “equity” is used in the name of the tool indicates the potential usefulness in assisting targeting resources to “vulnerable and underserved communities”.
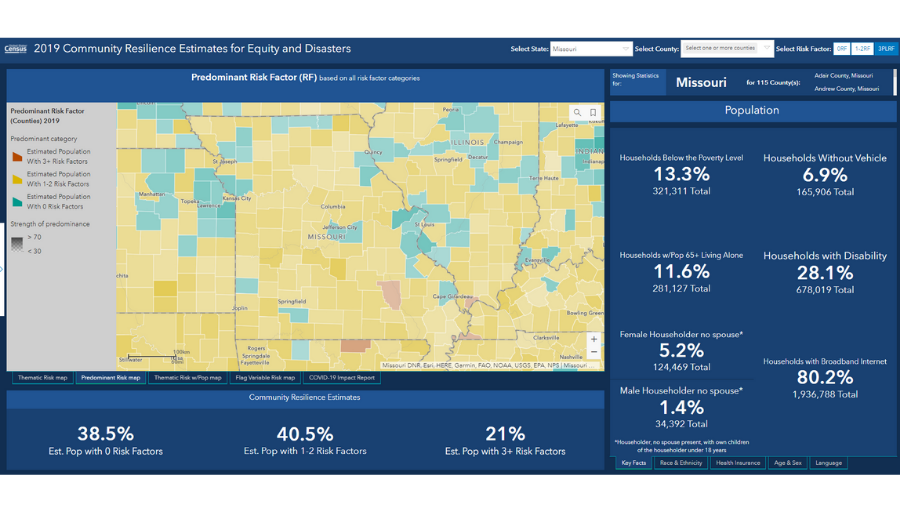
To make data comparison simple, the CRE Tool indicates three levels of Risk Factors for populations:
- Estimated Population With 0 Risk Factors
- Estimated Population With 1-2 Risk Factors
- Estimated Population With 3+ Risk Factors
For the entire State of Missouri, the CRE tool estimates:
- 38.5% of the population have 0 Risk Factors (or 2.3 million residents)
- 40.5% of the population have 1-2 Risk Factors (or 2.4 million residents)
- 21% of the population have 3+ Risk Factors (or 1.3 million residents)
Explore our other Child Care Aware® of Missouri resources:
FREE Clock Hour Training
Scholarships for Educators
Child Care Health and Wellness
Family Child Care Network
Leadership Development Opportunities
Missouri Office of Childhood Updates
Show Me Child Care Resources
Support Child Care Aware® of Missouri
Community Data
Join Our Team
Resources to Build Your Business
.png?width=666&height=414&name=Child%20Care%20Aware%20Logo%20(1).png)